Architectural acoustics

Room-acoustics design with RaySound

Per-band prediction, treatment sizing, and a technical report that holds up in a tender. On surveyed geometry and real materials.

Framing

The acoustic requirement is a number you have to demonstrate

In public procurement, internal acoustics is a binding requirement to be demonstrated at design stage and verified at handover. Italy’s Minimum Environmental Criteria for construction — today DM 24/11/2025, in force since 2 February 2026 — reference UNI 11532-2 for school environments, with the descriptors of ISO 3382-1. The chain is therefore entirely quantitative: geometry and materials in, per-band descriptors out, comparison against the regulatory interval. The designer has to produce that number, defend it, and know what its uncertainty is worth.

A prediction is not enough

Knowing how a room will sound verifies a design that is already done. Designing it is the opposite problem: which surfaces to treat, and by how much. In practice that is solved by trial and error, with a model revision at every attempt. RaySound starts from the specified target and arrives at the sizing, and when the available data cannot support the calculation it says so with a figure before delivery.

Evidence

Three real rooms, three different questions

The verification runs on the public BRAS benchmark of TU Berlin: real rooms, surveyed geometry, materials characterised surface by surface, measured impulse responses. The engine receives geometry and materials and produces the prediction. No parameter is adjusted to move closer to the measurement, and the figures below are what comes out first time.

1.1 % deviation on measured reverberation time, auditorium — analytical T60; the ray-tracer, which is an independent prediction, sits at 17.1 %
+0.89 correlation of the spatial clarity pattern
6/7 material degrees of freedom certified recoverable on a real room
0 parameters recalibrated to approach the measurement
Room Reverberation time Clarity by position Specific difficulty
Auditorium
8657 m³
1,1 %
max 1.9% · 19 bands · ray-tracer 17.1%
+0,89
5 measured positions
Balcony, raked seating, sloped ceiling: no equivalent box describes them.
Music room
3331 m³
1,3 %
max 2.6% · 19 bands · ray-tracer 11.5%
+0,68
5 measured positions · wide 95% CI
A quarter of the volume and different finishes, same engine, no adjustments.
Communicating volumes
178 + 127 m³
4.34 / 3.52 s
both slopes, no fit
closed
within the perceptual threshold
In the benchmark public round robin, six geometric algorithms out of six stop here.
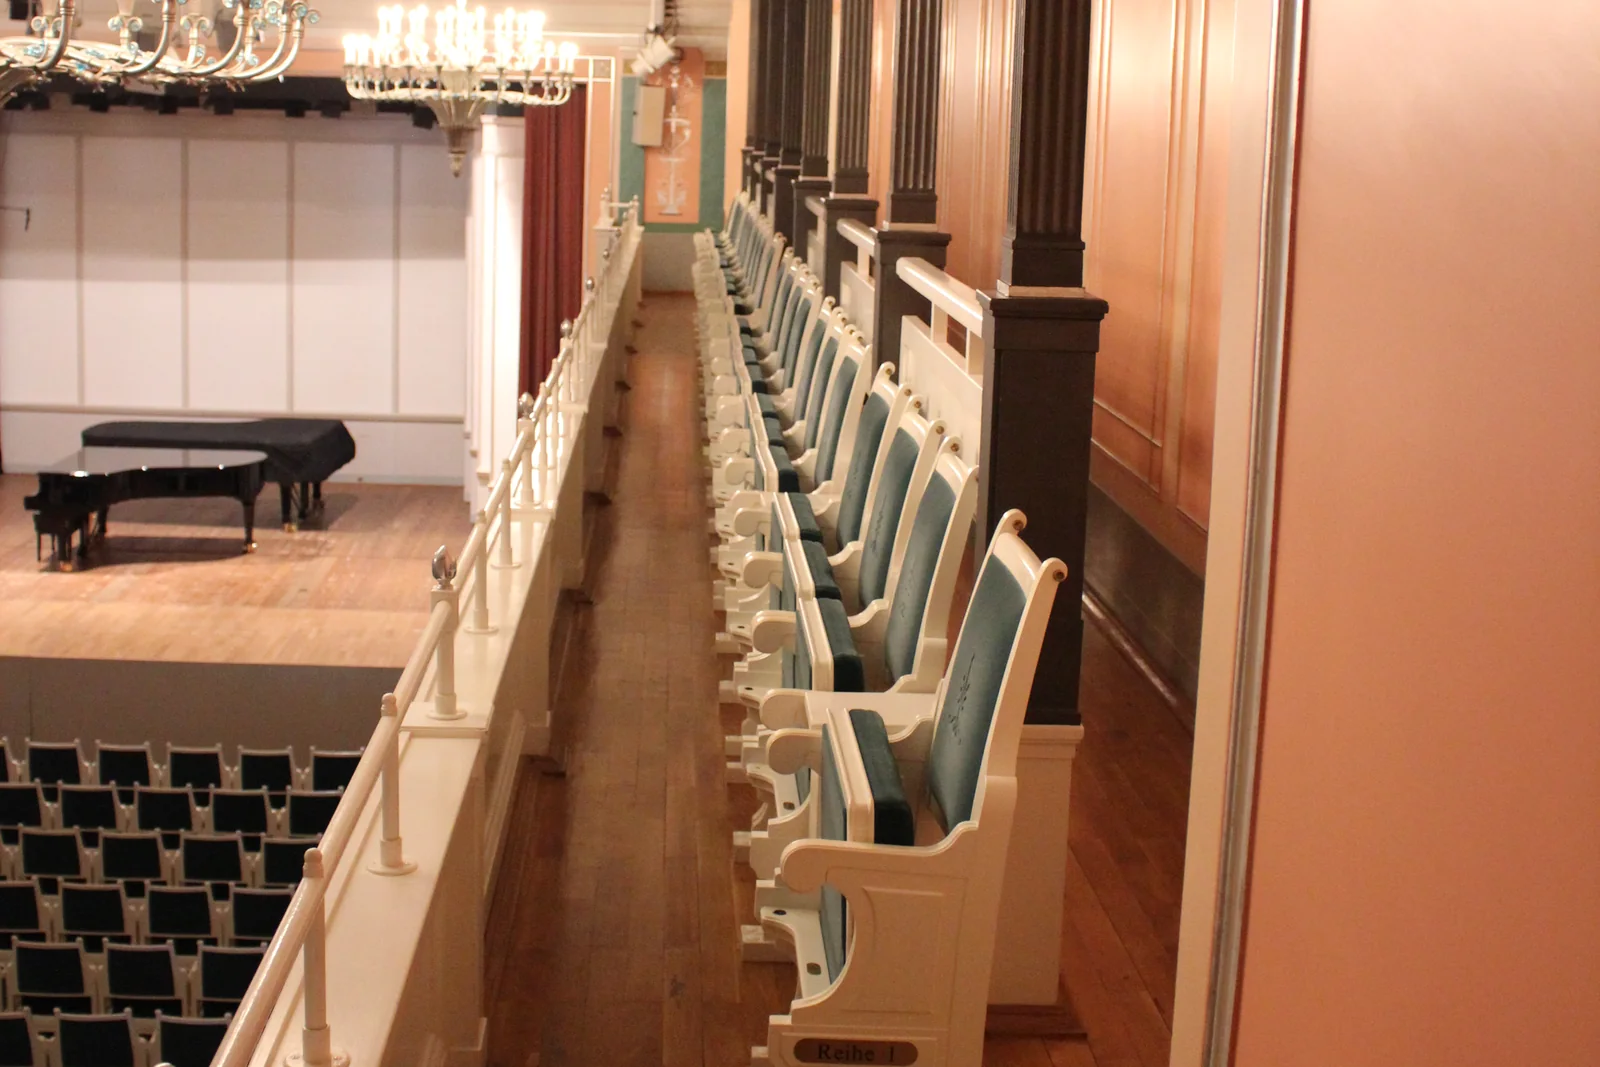
Balcony of a music hall: upholstered seats, wooden floor, columns, stage with a grand piano
One of the benchmark rooms. Upholstered seats, wooden balustrade and columns, boarded floor, the parterre below, a reflective stage: each of these surfaces has a different absorption in a different place, and the result on the balcony is not the result in the stalls. This is the geometry the calculation receives, with the materials declared face by face. Photograph from the BRAS dataset of TU Berlin, the public benchmark of measured rooms the engine is verified against.
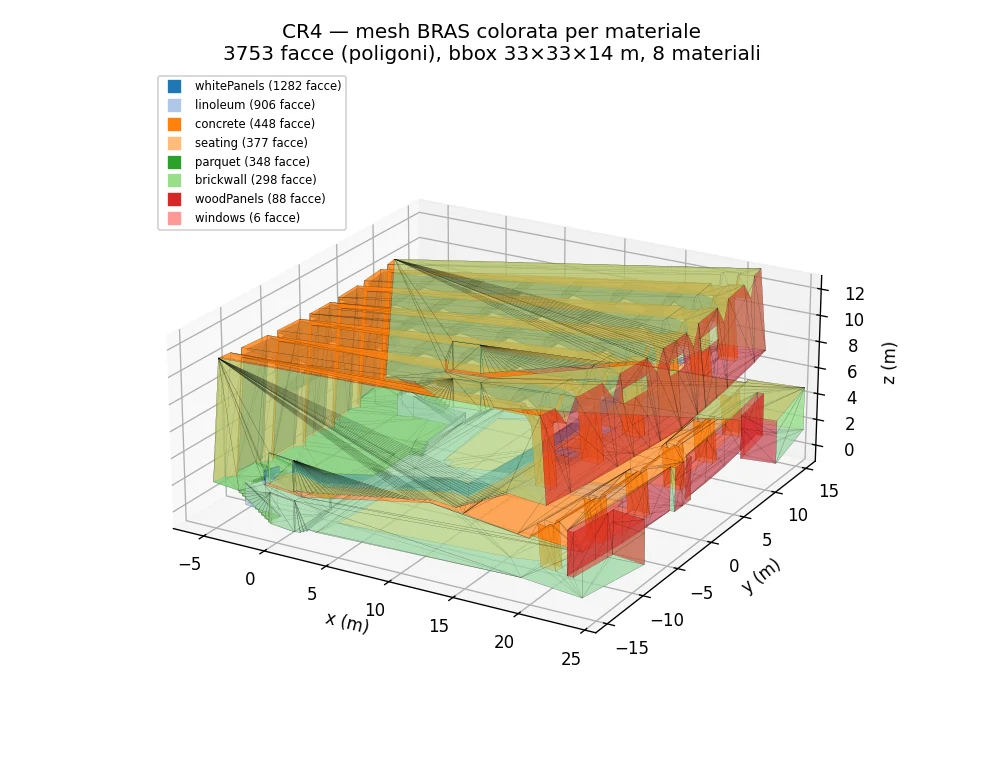
Geometric model: Auditorium, coloured by material
Auditorium 8657 m³
3753 faces, eight materials: brick, wood, linoleum, glass, seating. Balcony, raked seating and sloped ceiling stay where they are, each with its own absorption. A box of equivalent volume would lose exactly the surfaces that govern clarity at the back of the room.
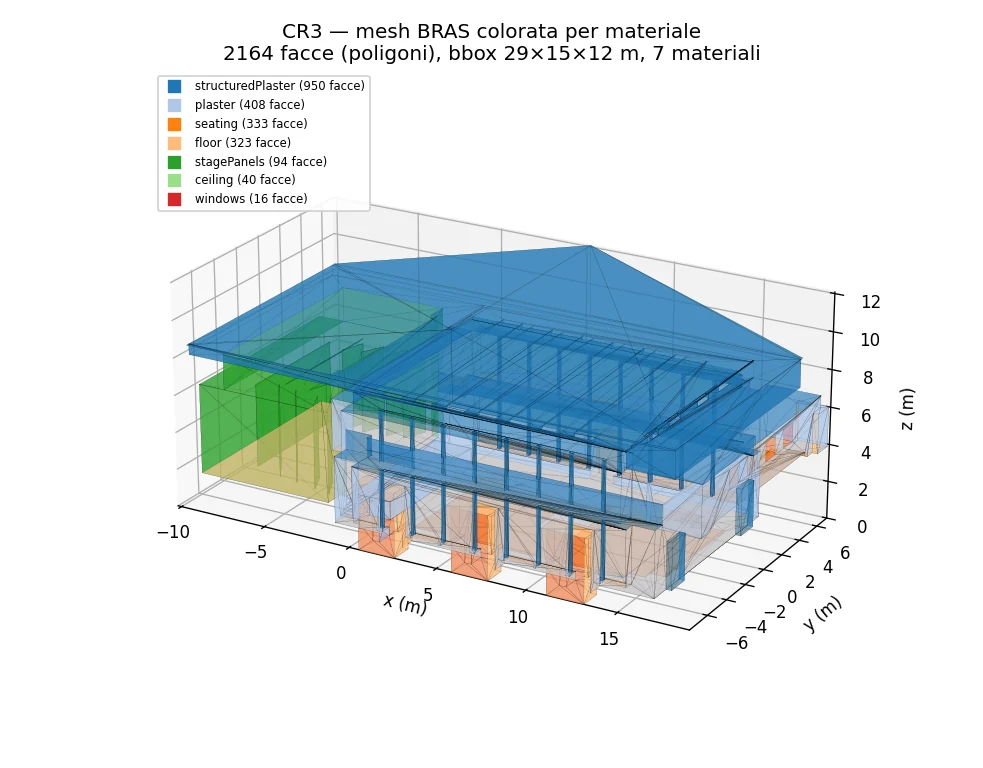
Geometric model: Music room, coloured by material
Music room 3331 m³
Stage and balcony, seven materials. A different volume and different finishes from the auditorium: accuracy does not track the single room.
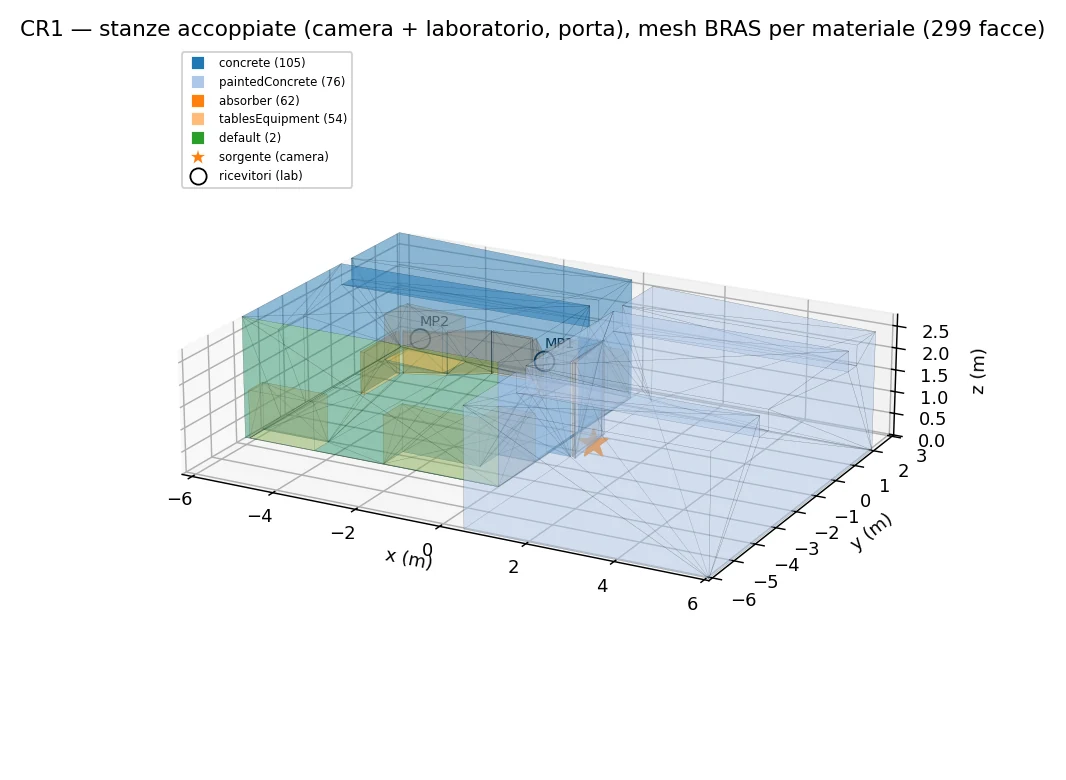
Geometric model: Communicating volumes, coloured by material
Communicating volumes 178 + 127 m³
Two spaces joined by a doorway of about 3 m². The decay has two slopes, and a foyer open onto a hall or a canteen on two levels behaves the same way.

Why the third row matters. Communicating spaces are the norm in public buildings: a foyer open onto the hall, a canteen on two levels, an atrium with a gallery. Their decay has two slopes, and a single-tail model does not reproduce them. In the benchmark public round robin, six geometric algorithms out of six stopped here. If your project has volumes that communicate, this is the row that concerns you.

The perimeter of the figure. These deviations hold with known materials: the benchmark declares them, and the engine uses them as inputs. On an existing building the absorption values of the surfaces come from a field survey, and the report states the margin that survey leaves open.

The differentiator

From the specification to the panel, with the uncertainty in the open

Inverse design

Simulators solve the forward problem: given the room, predict the field. Here you start from the other end. Given a specification target, the engine finds which surfaces to treat and by how much — and in the frequency-dependent variant the result is not an abstract coefficient but the thickness in millimetres of a realisable panel. The deliverable is directly orderable.

numerical gate

Identifiability diagnosis

Before calibrating against a measurement, the engine establishes whether that data holds enough information to tell apart the parameters you want to estimate, and how many degrees of freedom are actually constrained. On a real surveyed room it certifies six out of seven: the design starts knowing what it can count on.

validated on measurement

Why this matters in a tender

A dispute over an acoustic handover test is won or lost on the traceability of the number. Being able to attach, alongside the prediction, formal evidence of which parameters the input data constrains and which it does not turns uncertainty from a weakness into an element of due diligence.

Two results that change the design

Occupancy is the biggest lever. People and seating are the room’s largest acoustic treatment and belong in the budget before the panels: on the auditorium they are worth almost two decibels of clarity on their own, and the residual panel sizing drops by 40 %. Designing on an empty room oversizes the treatment.

The worst seat is a different problem from the average seat. Average clarity is governed by absorption and position is irrelevant; worst-seat clarity is a deficit of direct energy, and it is distance-limited. On the auditorium’s worst quartile the direct sound is two and a half times lower while the tail is uniform: reflectors pay the same distance, and past a point closing the gap needs active reinforcement. The engine says so before the panel is fitted.

Scope

What it works on, and with which data

The engine is built for the enclosed spaces where a standard asks for a figure: classrooms, auditoria, conference rooms, canteens, shared spaces. It works on surveyed geometry — not on an equivalent box — and on materials declared per surface.

One thing changes the quote, and it should be clear from the start. On an existing building the absorption values of the surfaces are measured on site: no catalogue supplies them as a nameplate figure. The survey, geometric and acoustic, is therefore part of the commission. On a new design we start from the datasheets of the specified materials and no survey is needed.

What we provide

Technical service on commission

Available today

Technical service on commission

Geometry and specification in; per-band prediction, treatment sizing, diagnosis and technical report out.

In development

Hearing the room before it is built

We are working on auralization: the simulation is turned into something you can listen to, so a client can hear the difference between two treatment options instead of reading it in decibels. Useful above all when the decision sits with someone who does not read a prediction.

What we deliver

  1. Per-band prediction of the ISO 3382-1 descriptors, with the calculation convention made explicit.
  2. Spatial map over the stalls, with out-of-domain points marked invalid rather than estimated anyway.
  3. Treatment sizing: absorbing area, realisable thicknesses, distribution per surface, empty and occupied.
  4. Diagnosis of what the input data constrains and what it does not, with the associated uncertainty.
  5. Comparison against the regulatory limits for the intended use, and a technical report with the numbers traceable.

What we need from you

  • Geometry: a 3D model — IFC or gbXML if the workflow is BIM — or a dimensioned survey.
  • Materials: specification or build-ups. Failing that we work on ranges, and the diagnosis states how much that uncertainty weighs.
  • Intended use and expected occupancy: they set the applicable limits.
  • If available: measurements of the existing state, which allow verification and calibration within the limits the diagnosis states.
Going deeper

Method, equations and benchmark

Submit a real room

Send us the geometry and specification of a room you have to design or verify: we return the per-band prediction, the treatment sizing and the diagnosis of what that data actually constrains.